viz.timeseries() selects one variable at exactly one longitude, latitude,
and depth (or the singleton surface) through cube_extract(), then draws
the stored values against time. It does not aggregate, smooth, interpolate,
impute, or otherwise transform the selected observations.
Usage
viz.timeseries(
  x,
  variable,
  longitude = NULL,
  latitude = NULL,
  depth = NULL,
  time_from = NULL,
  time_to = NULL,
  match = c("exact", "nearest"),
  tolerance = NULL,
  limits = NULL,
  na.rm = FALSE,
  points = FALSE,
  title = NULL,
  subtitle = NULL,
  caption = NULL
)
Arguments
- x
A valid
<ocean_cube>using the memory or NetCDF backend.- variable
Exactly one non-empty, non-missing variable name present in
x.- longitude
A single stored longitude. May be
NULLonly when the cube contains one longitude.- latitude
A single stored latitude. May be
NULLonly when the cube contains one latitude.- depth
A single stored depth. May be
NULLonly for a singleton depth axis, including a singletonNA_real_surface depth.- time_from, time_to
Optional scalar
DateorPOSIXctbounds compatible with the cube time axis. Together they define the inclusive closed interval[time_from, time_to]; aNULLbound leaves that side open.- match
Matching method passed explicitly to
cube_extract(). Exact stored-value matching is the default;"nearest"selects a stored grid cell without interpolation.- tolerance
Optional nearest-matching tolerance passed unchanged to
cube_extract().- limits
NULLor two finite numeric value-axis limits in increasing order. Values outside the limits are squished to the scale boundary and rows are not removed.- na.rm
A single non-missing logical value. If
FALSE, the default, missing values remain in the plotted data and interrupt the raw line. IfTRUE, missing rows are excluded and separated observations may therefore appear connected; values are never imputed or replaced with zero.- points
A single non-missing logical value. If
TRUE, points are drawn over the line.- title, subtitle, caption
Optional character scalars used as plot labels.
Value
A ggplot object. The selected variable, matched coordinates, depth,
represented time range, number of temporal rows, backend, matching settings,
and point-to-cell distance are recorded in oceancube_* attributes.
Details
The simple series contract is exactly one variable, one longitude, one latitude, one depth or surface, and multiple stored time positions. A bounded interval is inclusive. Canonical cube time is already unique and strictly increasing; extracted rows are plotted in stable chronological order and are never averaged or deduplicated. POSIXct bounds use instant semantics and may be expressed in a display timezone other than canonical UTC.
Data selection is delegated to cube_extract(mode = "series"). For a lazy
NetCDF cube, a unique bounded time selection reads only the selected point,
depth, times, and variable (or the backend's minimal physical envelope), not
the complete cube.
Examples
if (requireNamespace("ggplot2", quietly = TRUE)) {
  values <- array(c(18, 17, NA, 15), dim = c(1, 1, 1, 4, 1))
  cube <- ocean_cube(
    lon = -79, lat = -11, depth = 0,
    time = as.Date("2020-01-01") + 0:3,
    data = values, vars = "temperature", units = "degC"
  )
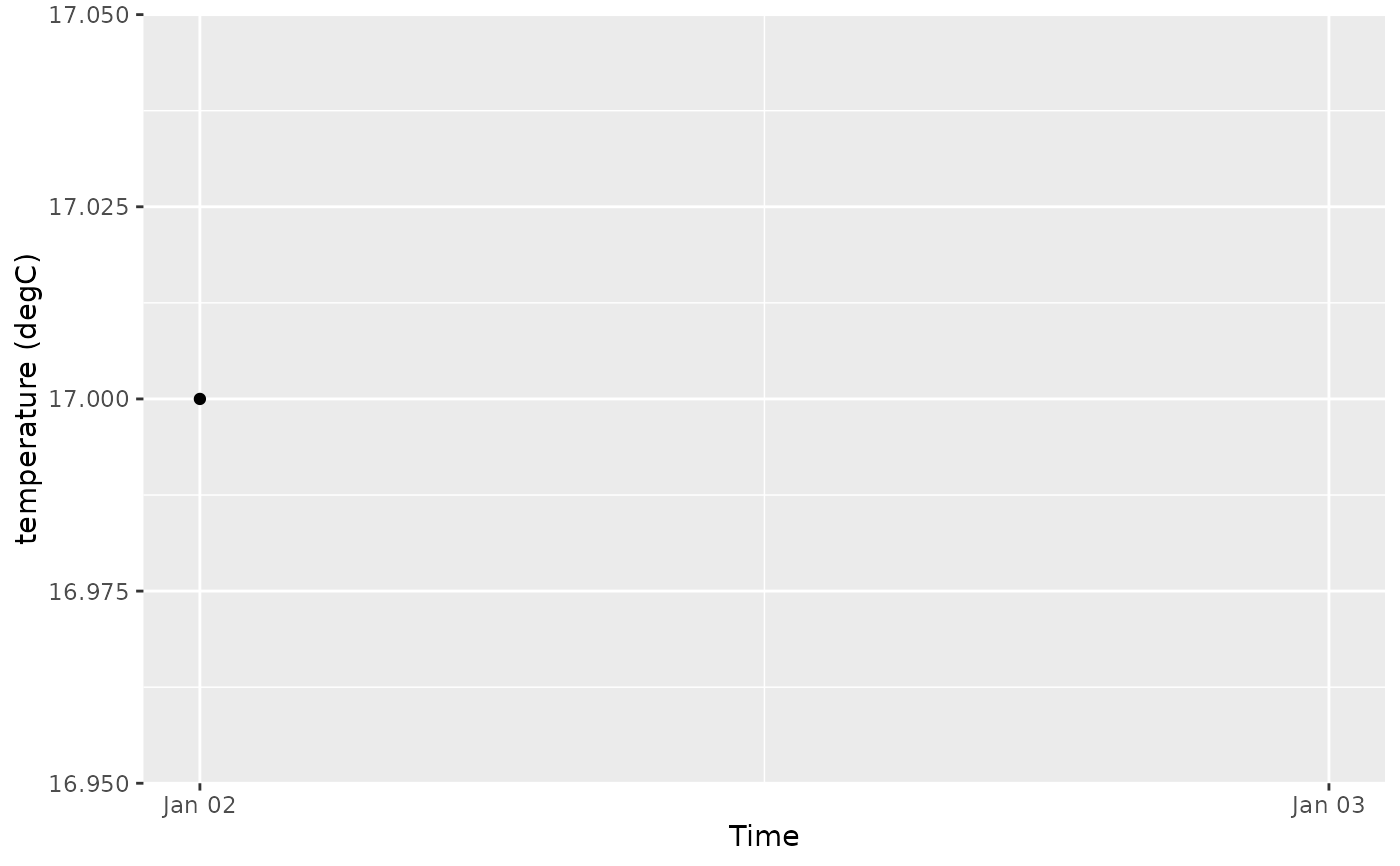
  viz.timeseries(cube, "temperature")
  viz.timeseries(
    cube, "temperature",
    time_from = as.Date("2020-01-02"),
    time_to = as.Date("2020-01-03"),
    points = TRUE
  )
}
#> Warning: Removed 1 row containing missing values or values outside the scale range
#> (`geom_line()`).
#> `geom_line()`: Each group consists of only one observation.
#> ℹ Do you need to adjust the group aesthetic?
#> Warning: Removed 1 row containing missing values or values outside the scale range
#> (`geom_point()`).