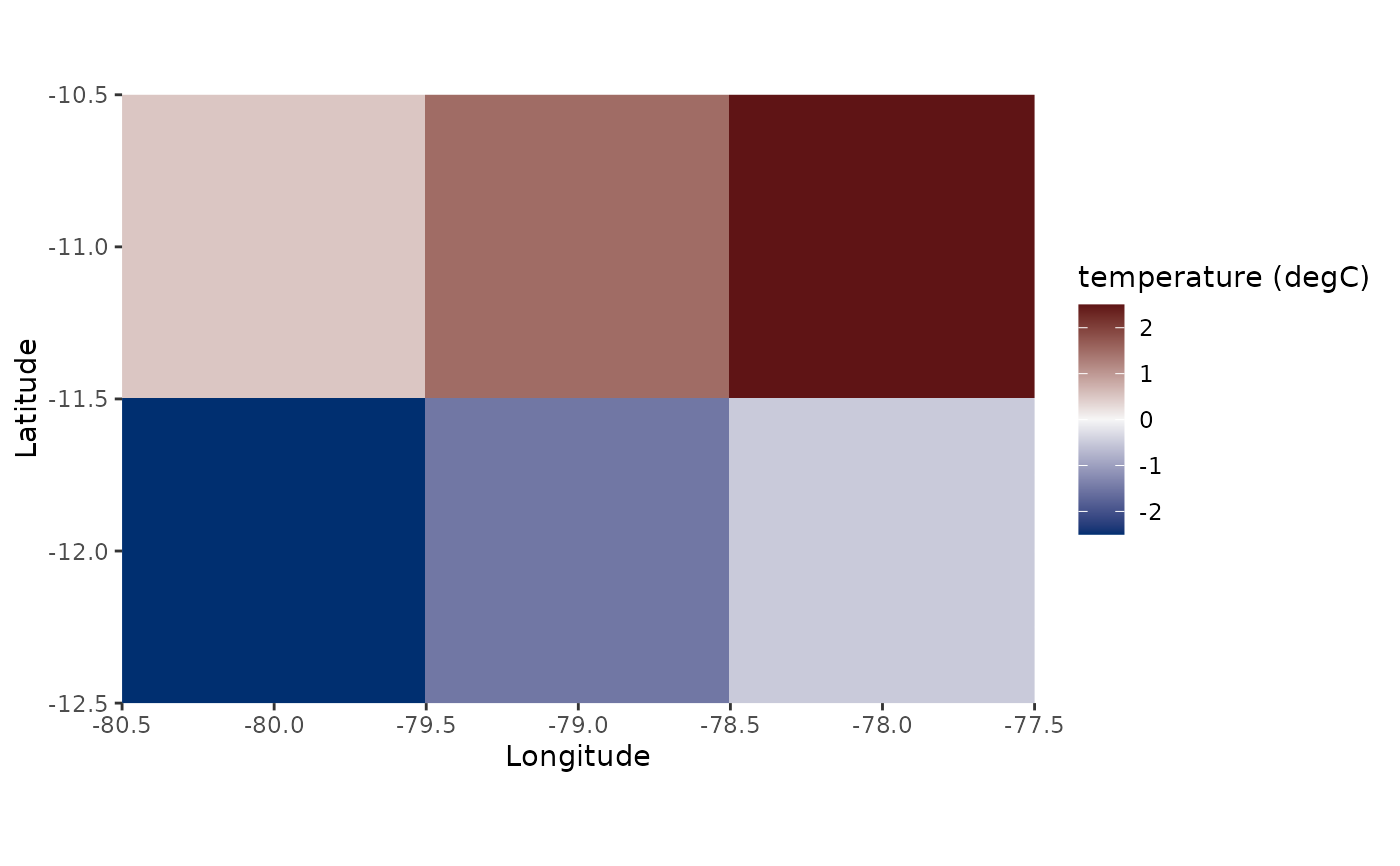
viz.map() selects exactly one variable, time, and depth layer through
cube_extract() and draws its stored grid without interpolation. Regular
grids use a raster layer and irregular grids use tiles. Explicit contour
styles calculate renderer-only isoline geometry; they never interpolate,
regrid, smooth, fill, or replace the prepared scientific values. NetCDF
inputs read only the selected layer rather than materializing the complete
cube.
Usage
viz.map(
  x,
  variable,
  time = NULL,
  depth = NULL,
  limits = NULL,
  na.rm = TRUE,
  coastline = NULL,
  title = NULL,
  subtitle = NULL,
  caption = NULL,
  style = c("field", "contour", "field_contour", "filled_contour"),
  scale_class = c("unspecified_continuous", "sequential", "diverging"),
  center = NULL,
  contour_breaks = NULL,
  longitude_display = c("source", "neg180_180", "zero_360")
)
Arguments
- x
A valid
<ocean_cube>.- variable
A single non-missing variable name present in
x.- time
A single stored
DateorPOSIXctvalue. May beNULLonly when the cube has one time value.- depth
A single stored numeric depth. May be
NULLonly for a surface cube or a cube with one depth value.- limits
NULLor two finite numeric fill-scale limits in increasing order. Values outside the limits are squished to the scale boundary and rows are not removed.- na.rm
A single non-missing logical value. If
TRUE, missing cells are removed before plotting.- coastline
Optional coastline supplied as an
sf/sfcobject or a data frame withlongitude,latitude, andgroupcolumns. Coordinates and CRS are used as supplied and are not transformed.- title, subtitle, caption
Optional character scalars used as plot labels.
- style
Map rendering style.
"field"preserves the historical direct raster/tile rendering."contour"draws display-only isolines and"field_contour"overlays those isolines on the direct field."filled_contour"is reserved but currently errors because its missing- support and continuous-scale contract is not yet certified.- scale_class
Scientific colour-scale class. The historical
"unspecified_continuous"default preserves the existing scale exactly."sequential"uses deterministic viridis option D."diverging"uses a deterministic base-R HCL palette and requires an explicitcenter.- center
NULLor one finite scientifically meaningful centre. It is required forscale_class = "diverging", must lie strictly inside the effective display range, and is invalid for other scale classes. Zero is never assumed.- contour_breaks
NULLor at least one finite, strictly increasing contour level. WhenNULL, explicit contour styles use deterministicpretty()breaks from the finite display range withn = 7.- longitude_display
Display-only longitude convention:
"source"preserves stored coordinates,"neg180_180"wraps to [-180, 180), and"zero_360"wraps to [0, 360). Scientific coordinates, selection, provenance, and QA are unchanged. A wrap that introduces an internal dateline discontinuity fails explicitly.
Value
A ggplot object with selected variable, time, depth, and backend
recorded in oceancube_* attributes.
Examples
if (requireNamespace("ggplot2", quietly = TRUE)) {
  values <- array(1:6, dim = c(3, 2, 1, 1, 1))
  cube <- ocean_cube(
    lon = c(-80, -79, -78), lat = c(-12, -11), depth = 0,
    time = as.Date("2020-01-01"), data = values,
    vars = "temperature", units = "degC"
  )
  viz.map(cube, "temperature", title = "Surface temperature")
  viz.map(
    cube, "temperature", style = "field_contour",
    scale_class = "sequential", contour_breaks = c(2, 4)
  )

  signed <- cube
  signed$data <- signed$data - 3.5
  viz.map(signed, "temperature", scale_class = "diverging", center = 0)
}