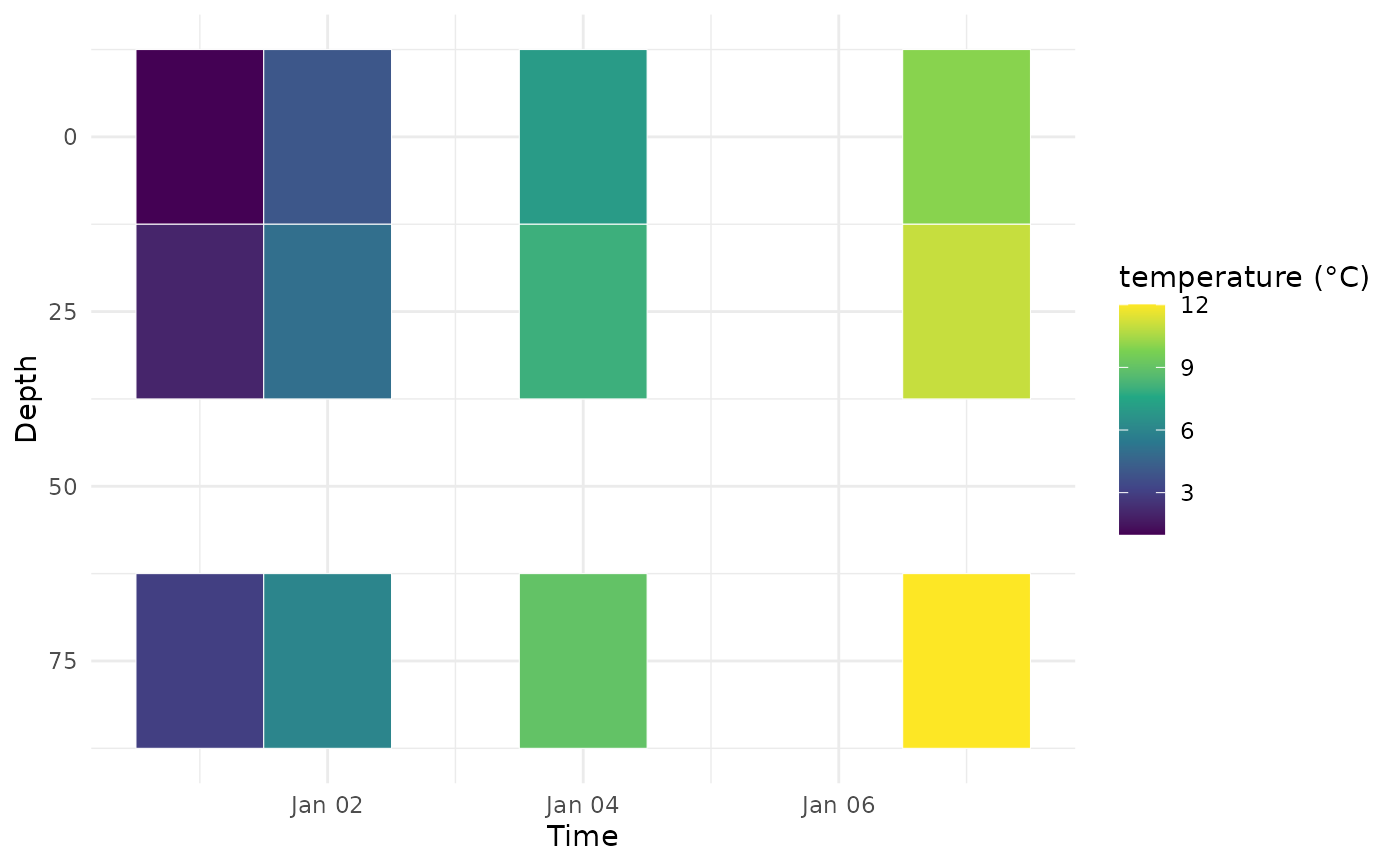
viz.hovmoller() selects one variable over stored time and exactly one
longitude, latitude, or depth axis. Every other non-singleton dimension must
be selected explicitly. It never averages, aggregates, interpolates,
smooths, fills, calculates a climatology or anomaly, or estimates a trend.
Usage
viz.hovmoller(
  x,
  variable,
  axis = c("longitude", "latitude", "depth"),
  longitude = NULL,
  latitude = NULL,
  depth = NULL,
  time_from = NULL,
  time_to = NULL,
  match = c("exact", "nearest"),
  tolerance = NULL,
  limits = NULL,
  na.rm = FALSE,
  reverse_depth = TRUE,
  title = NULL,
  subtitle = NULL,
  caption = NULL
)
Arguments
- x
A valid
<ocean_cube>using the memory or NetCDF backend.- variable
Exactly one non-empty, non-missing variable name present in
x.- axis
Coordinate retained with time:
"longitude","latitude", or"depth". Time is always displayed from left to right on the x axis.- longitude, latitude, depth
Stored coordinate selectors for dimensions not named by
axis. A selector may beNULLonly when that dimension is singleton. The selector for the displayed axis must remainNULL, so the complete stored axis is retained without hidden reduction.- time_from, time_to
Optional scalar
DateorPOSIXctbounds compatible with the cube time axis. The represented interval is inclusive and no temporal resampling or regularization is performed.- match
Matching method for fixed coordinates.
"exact"is the default;"nearest"selects stored coordinates without interpolation.- tolerance
Optional nearest-matching tolerance passed unchanged to
cube_extract().- limits
NULLor two finite numeric fill-scale limits in increasing order. Limits affect display only and never remove or modify values.- na.rm
A single non-missing logical value.
FALSEpreserves missing cells for explicit display;TRUEremoves missing rows without filling.- reverse_depth
A single non-missing logical value. For a time-depth diagram,
TRUEdisplays positive-down depth with the surface at the top. Scientific depth values are never changed.- title, subtitle, caption
Optional character scalars used as plot labels.
Value
A modifiable ggplot object carrying bounded oceancube_*
attributes for the selected variable, axis, represented time range, fixed
coordinates, depth, backend, source semantics, and prepared-data kind.
Details
The prepared data are the exact time-by-coordinate Cartesian support returned
by cube_extract(). Irregular stored spacing remains irregular and is drawn
with a deterministic display-only footprint positioned at stored coordinate
centres; subtle boundaries distinguish stored NA tiles from regions with
no stored centre. Gaps are not stretched into a continuous raster and no
scientific cell bounds are invented. The display label normalizes the
unambiguous degC alias to °C; stored unit metadata remain unchanged.
Calendar-aware non-base time axes are rejected explicitly because the D2A
ggplot renderer cannot represent them without inventing Gregorian dates.
Examples
if (requireNamespace("ggplot2", quietly = TRUE)) {
  values <- array(1:12, dim = c(1, 1, 3, 4, 1))
  cube <- ocean_cube(
    lon = -79, lat = -11, depth = c(0, 25, 75),
    time = as.Date("2020-01-01") + c(0, 1, 3, 6),
    data = values, vars = "temperature", units = "degC"
  )
  viz.hovmoller(cube, "temperature", axis = "depth")
}