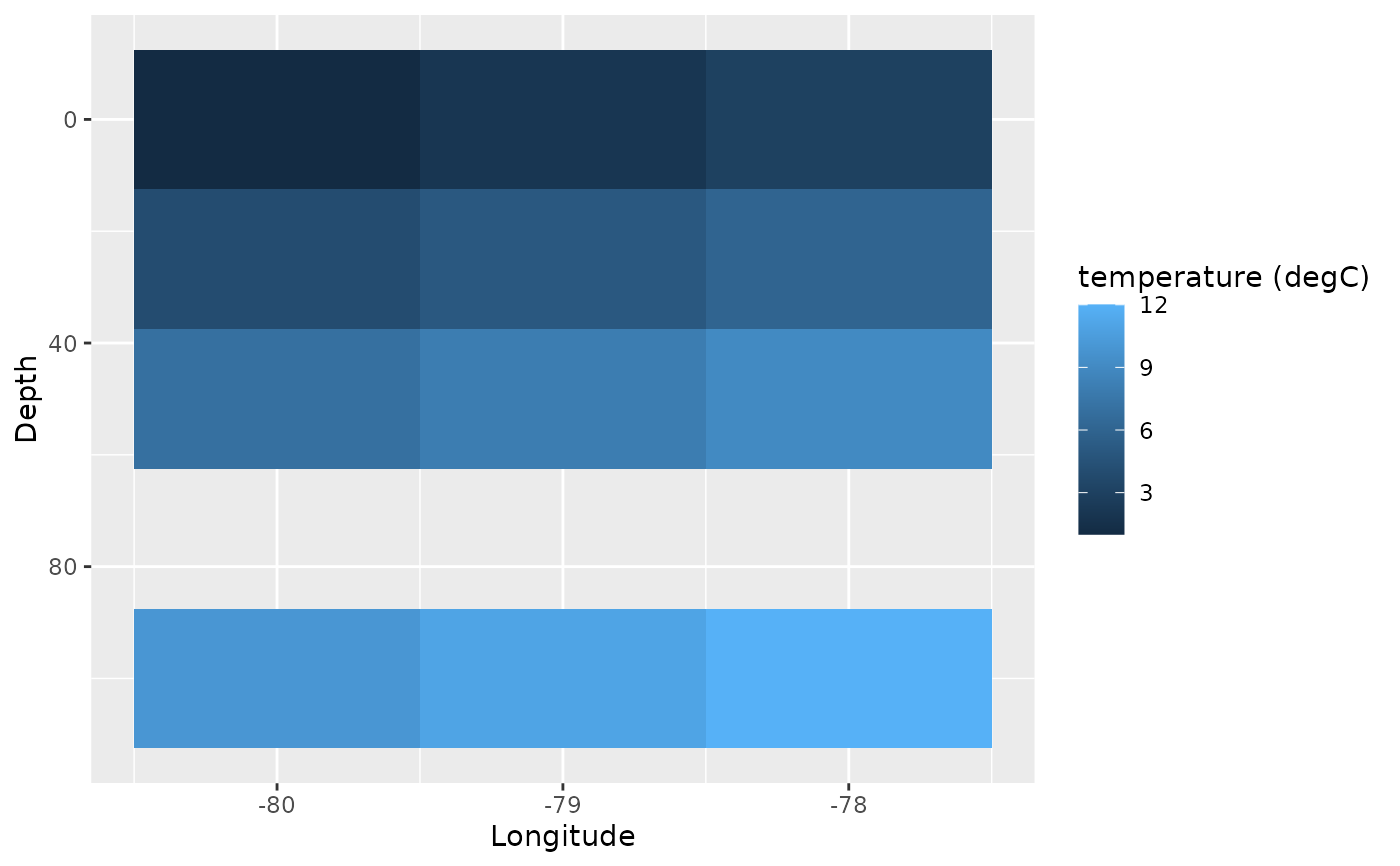
viz.section() selects one vertical plane through cube_extract() and
draws the stored horizontal-by-depth grid without interpolation or
aggregation. Longitude-depth sections fix one latitude; latitude-depth
sections fix one longitude. NetCDF inputs read only the selected plane.
Usage
viz.section(
  x,
  variable,
  section = c("longitude-depth", "latitude-depth"),
  time = NULL,
  longitude = NULL,
  latitude = NULL,
  depth = NULL,
  limits = NULL,
  na.rm = TRUE,
  reverse_depth = TRUE,
  title = NULL,
  subtitle = NULL,
  caption = NULL
)
Arguments
- x
A valid
<ocean_cube>.- variable
A single non-missing variable name present in
x.- section
Section orientation:
"longitude-depth"or"latitude-depth".- time
A single stored
DateorPOSIXctvalue. May beNULLonly when the cube has one time value.- longitude
A single stored longitude for a latitude-depth section. Must be
NULLfor a longitude-depth section and may beNULLfor a latitude-depth section only when the cube has one longitude.- latitude
A single stored latitude for a longitude-depth section. Must be
NULLfor a latitude-depth section and may beNULLfor a longitude-depth section only when the cube has one latitude.- depth
Optional finite, unique stored depth values.
NULLretains all depths. A section must contain at least two depth levels.- limits
NULLor two finite numeric fill-scale limits in increasing order. Values outside the limits are squished to the scale boundary and rows are not removed.- na.rm
A single non-missing logical value. If
TRUE, missing cells are removed before plotting.- reverse_depth
A single non-missing logical value. If
TRUE, smaller depth values appear at the top of the plot.- title, subtitle, caption
Optional character scalars used as plot labels.
Value
A ggplot object with the selected variable, time, section, fixed
coordinate, depth range, and backend recorded in oceancube_* attributes.
Examples
if (requireNamespace("ggplot2", quietly = TRUE)) {
  values <- array(1:12, dim = c(3, 1, 4, 1, 1))
  cube <- ocean_cube(
    lon = c(-80, -79, -78), lat = -11, depth = c(0, 25, 50, 100),
    time = as.Date("2020-01-01"), data = values,
    vars = "temperature", units = "degC"
  )
  viz.section(cube, "temperature")
}